|
|
 |

-
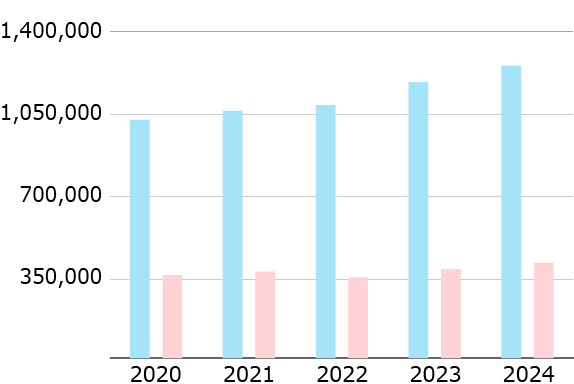
■Net
sales
■Gross
profit
(Millions of yen)
-
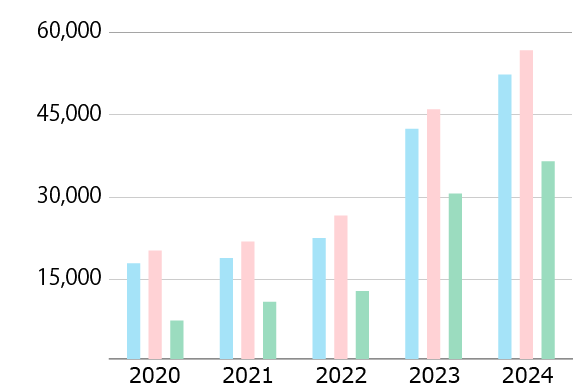
■Operating
income
■Ordinary
income
■Profit
attributable to owners of parent
(Millions of yen)
-
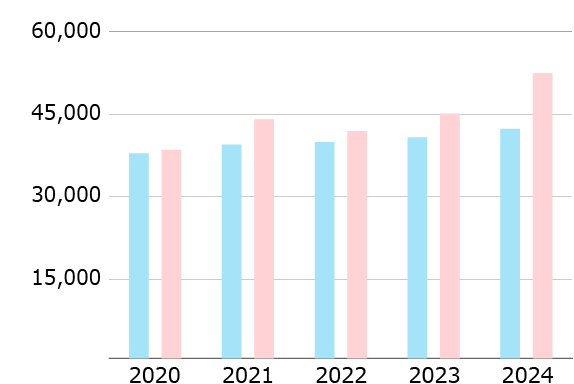
■Depreciation
and amortization
■Capital
investment
(Millions of yen)
-
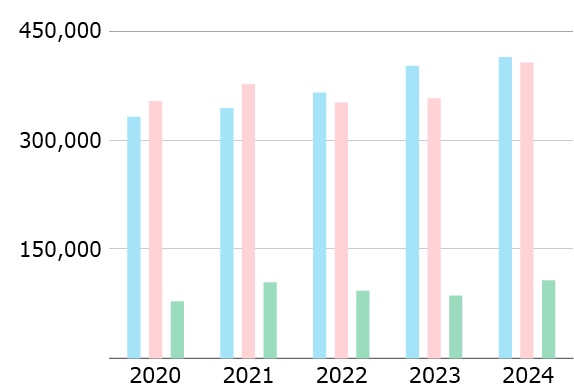
■Total
stockholders' equity
■Total
liabilities
■Interest-bearing
debt
(Millions of yen)
| |
2019 |
2020 |
2021 |
2022 |
2023 |
| Net sales
|
¥1,061,152 |
¥1,014,741 |
¥1,052,972 |
¥1,077,009 |
¥1,175,562 |
| Gross profit
|
374,795 |
353,618 |
367,855 |
343,607 |
379,046 |
| Operating
income |
24,824 |
17,438 |
18,359 |
22,032 |
41,962 |
| Ordinary
income |
27,621 |
19,734 |
21,382 |
26,127 |
45,526 |
Profit
attributable to
owners of parent
|
13,858 |
6,956 |
10,378 |
12,368 |
30,168 |
| Depreciation
and amortization |
37,188 |
37,420 |
38,997 |
39,436 |
40,318 |
| Capital
investment |
41,012 |
38,056 |
43,625 |
41,447 |
44,644 |
| Total
stockholders' equity |
327,253 |
330,486 |
342,574 |
363,738 |
400,137 |
| Total
liabilities |
369,732 |
352,060 |
375,135 |
350,133 |
355,902 |
|
Interest-bearing debt |
82,938 |
78,092 |
104,074 |
92,277 |
85,916 |
-
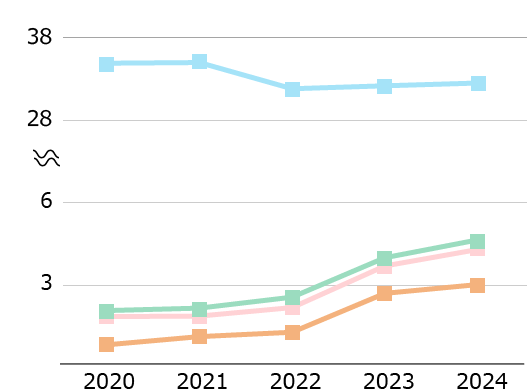
■Gross
profit margin
■Operating
margin
■Ordinary
income margin
■Net income
margin
(%)
-
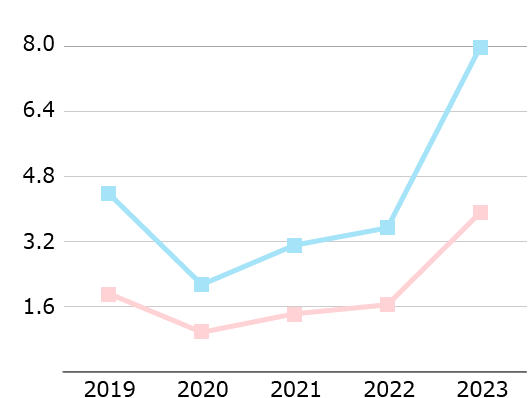
■Return on
equity (ROE)
■Return on
assets (ROA)
(%)
-
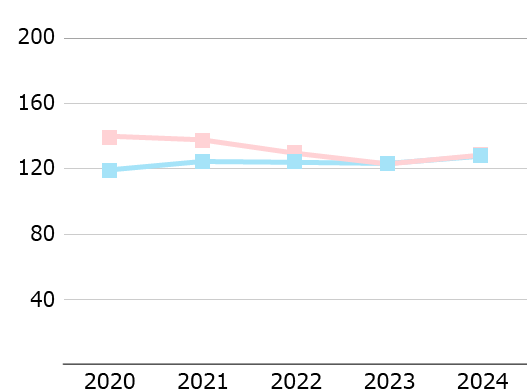
■Current
ratio
■Ratio of
total fixed assets to total stockholders' equity
(%)
-
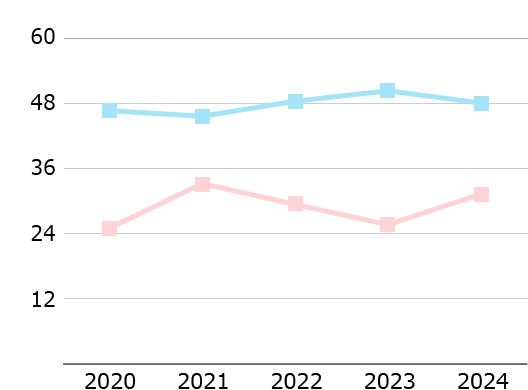
■Equity
ratio
■Debt-to-equity
ratio
(%)
| |
2019 |
2020 |
2021 |
2022 |
2023 |
| Gross profit
margin |
35.32% |
34.85% |
34.93% |
31.90% |
32.24% |
| Operating
margin |
2.34 |
1.72 |
1.74 |
2.05 |
3.57 |
| Ordinary
income margin |
2.60 |
1.94 |
2.03 |
2.43 |
3.87 |
| Net income
margin |
1.31 |
0.69 |
0.99 |
1.15 |
2.57 |
| Return on
equity (ROE) (1) |
4.33 |
2.12 |
3.08 |
3.50 |
7.90 |
| Return on
assets (ROA) (2) |
1.90 |
0.96 |
1.41 |
1.63 |
3.87 |
| Current ratio
|
116.85 |
118.11 |
123.25 |
122.74 |
122.07 |
Ratio of total
fixed assets to
total stockholders'
equity |
142.49 |
138.64 |
136.43 |
128.31 |
121.77 |
| Equity ratio
|
44.94 |
46.26 |
45.23 |
47.98 |
49.89 |
| Debt-to-equity
ratio (3) |
26.58 |
24.82 |
32.94 |
29.15 |
25.43 |
-
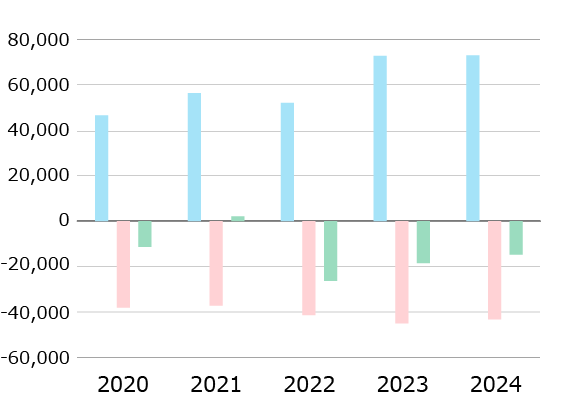
■Net cash
provided by operating activities
■Net cash
used in investing activities
■Net cash
provided by (used in) financing activities
(Millions of yen)
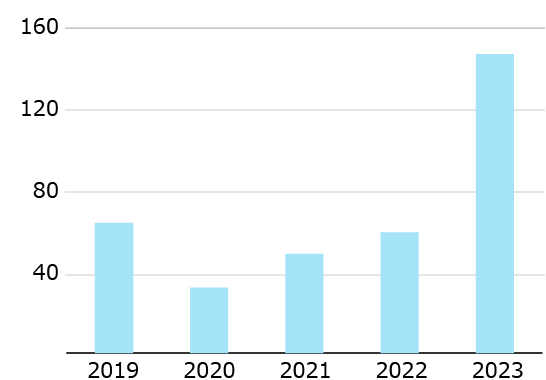
-
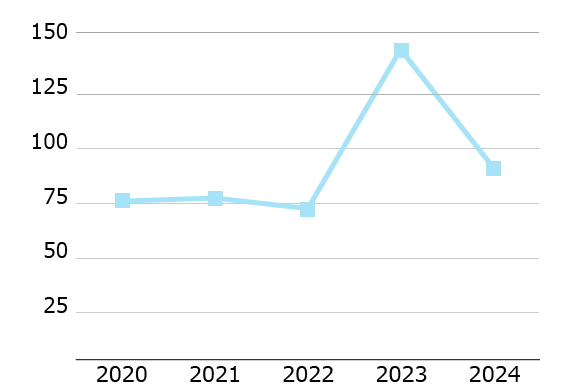
■Interest
coverage ratio
(Times)
-
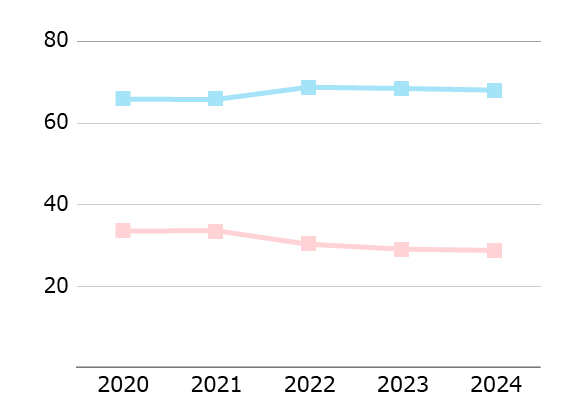
■Ratio of
cost of sales to net sales
■Ratio of
selling, general and
administrative
expenses to net sales
(%)
-
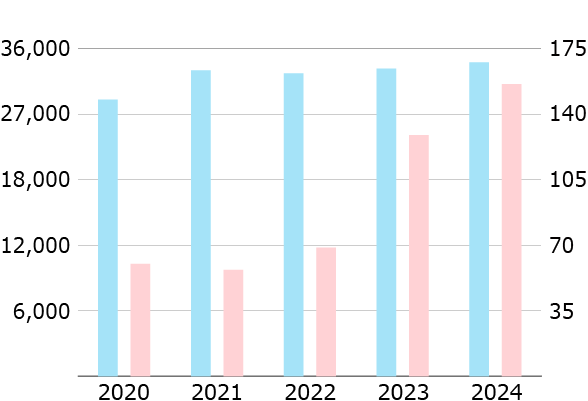
■Number of
employees
■Oparating
income per employee
(No.of
employees)
(Ten thouthand
of yen)
(Millions of yen,
Yen, Times, %, No.of employees)
| |
2019 |
2020 |
2021 |
2022 |
2023 |
| Net cash
provided by operating
| 57,880 |
47,157 |
57,071 |
52,773 |
73,689 |
| Net cash used
in investing activities |
(42,173) |
(38,623) |
(37,790) |
(41,984) |
(45,659) |
| Net cash
provided by (used in) financing
activities |
(18,466) |
(11,585) |
2,070 |
(26,695) |
(18,834) |
| Interest
coverage ratio (Times)(*) |
80.01 |
72.30 |
73.69 |
68.90 |
141.45 |
| Ratio of cost
of sales to net sales(%) |
64.7% |
65.2% |
65.1% |
68.1% |
67.8% |
| Ratio of
selling, general and administrative
expenses to net sales(%) |
33.0% |
33.1% |
33.2% |
29.9% |
28.7% |
| Number of
employees |
28,724 |
29,243 |
32,527 |
32,210 |
32,725 |
| Oparating
income per employee(Yen) |
864,249 |
596,331 |
564,440 |
684,041 |
1,282,263 |
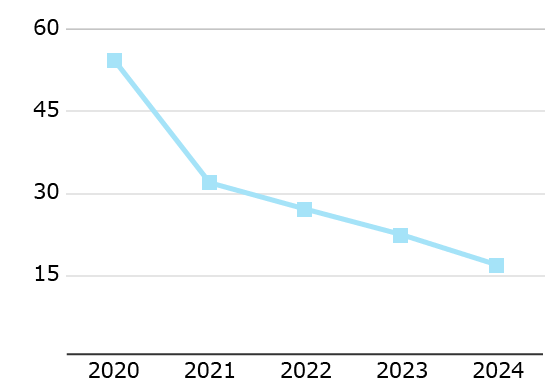
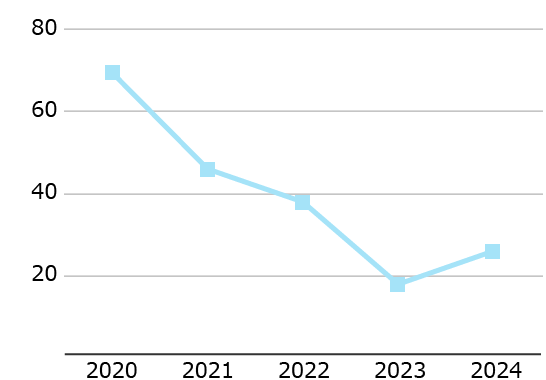
-
■Price-earnings
ratio
(Times)
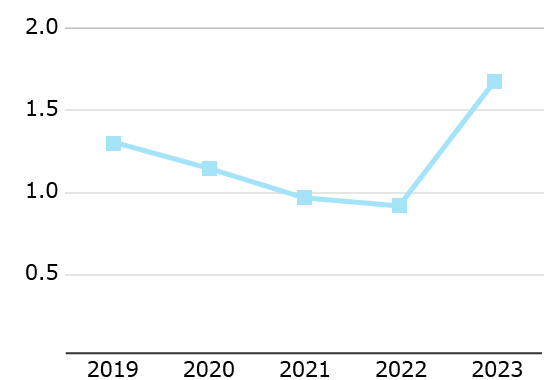
-
■Price-book
value ratio
(Times)
-
■Net income
per share
(Yen)
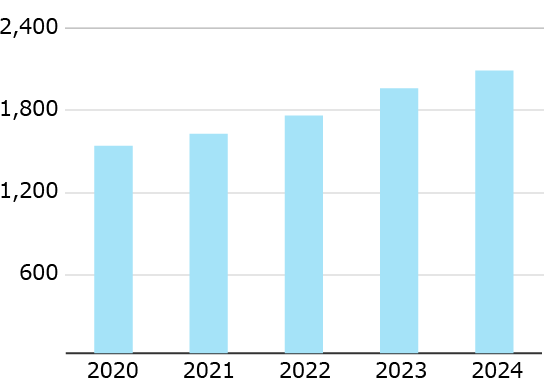
-
■Net assets
per share
(Yen)
-
■Dividend
payout ratio
(%)
| |
2019 |
2020 |
2021 |
2022 |
2023 |
| Price-earnings
ratio (Times) |
30.57 |
53.87 |
31.44 |
26.63 |
22.00 |
| Price-book
value ratio (Times) |
1.29 |
1.13 |
0.95 |
0.90 |
1.66 |
| Net income per
share(Yen) |
¥63.75 |
¥32.00 |
¥48.60 |
¥59.10 |
¥146.19 |
| Net assets per
share(Yen) |
1,505.37 |
1,520.24 |
1,609.57 |
1,743.42 |
1,942.85 |
| Dividend
payout ratio(%) |
31.37% |
68.75% |
45.27% |
37.22% |
17.10% |
|
|
|
|