|
|
 |

-
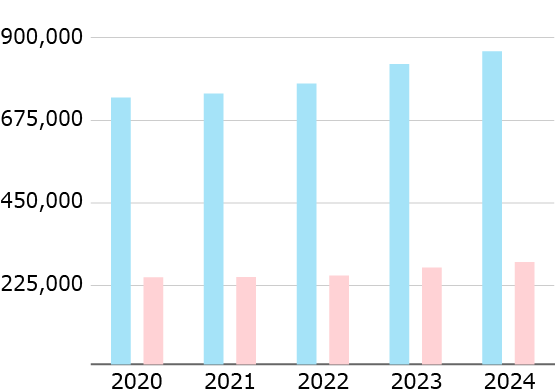
■Net
sales
■Gross
profit
(Millions of yen)
-
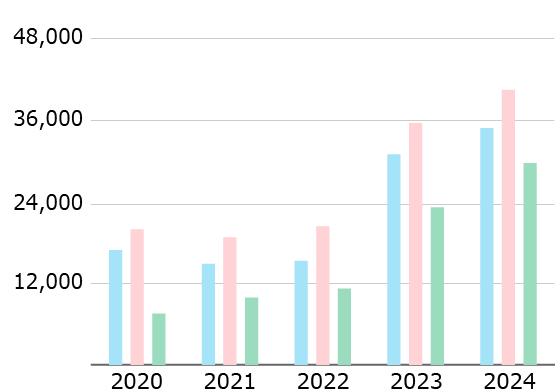
■Operating
income
■Ordinary
income
■Net income
(Millions of yen)
-
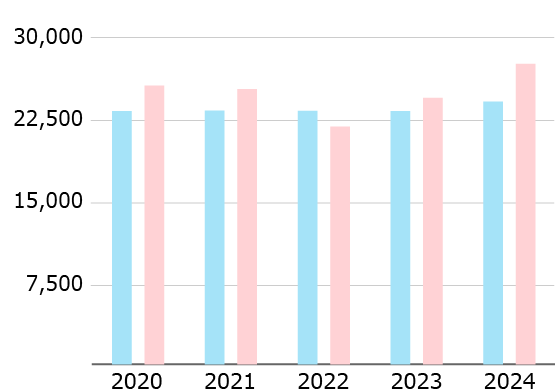
■Depreciation
and amortization
■Capital
investment
(Millions of yen)
-
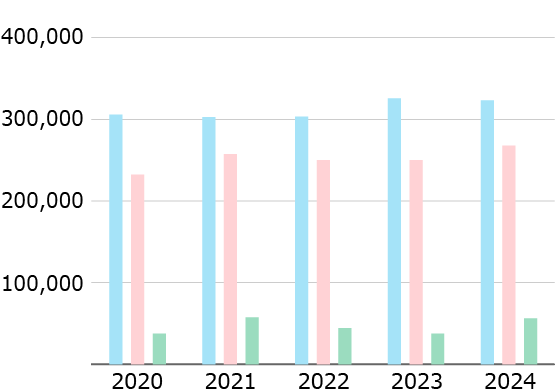
■Total
stockholders'
equity
■Total
liabilities
■Interest-bearing
debt
(Millions of yen)
| |
2021 |
2022 |
2023 |
2024 |
2025 |
| Net sales
|
¥741,371 |
¥768,695 |
¥821,632 |
¥857,028 |
¥891,198 |
| Gross profit
|
239,062 |
242,681 |
264,660 |
279,657 |
291,285 |
| Operating
income |
14,750 |
15,169 |
30,710 |
34,554 |
37,261 |
| Ordinary
income |
18,622 |
20,233 |
35,295 |
40,129 |
42,206 |
| Net income
|
9,821 |
11,134 |
22,987 |
29,454 |
30,052 |
| Depreciation
and amortization |
23,143 |
23,130 |
23,110 |
23,967 |
24,508 |
| Capital
investment |
25,120 |
21,701 |
24,317 |
27,407 |
29,437 |
| Total
stockholders' equity |
300,811 |
301,239 |
323,456 |
321,172 |
344,259 |
| Total
liabilities |
255,663 |
248,344 |
248,583 |
266,051 |
253,747 |
|
Interest-bearing debt |
57,081 |
44,044 |
37,452 |
56,049 |
47,487 |
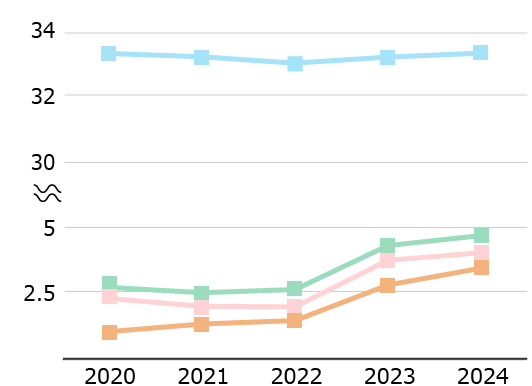
-
■Gross
profit margin
■Operating
margin
■Ordinary
income margin
■Net income
margin
(%)
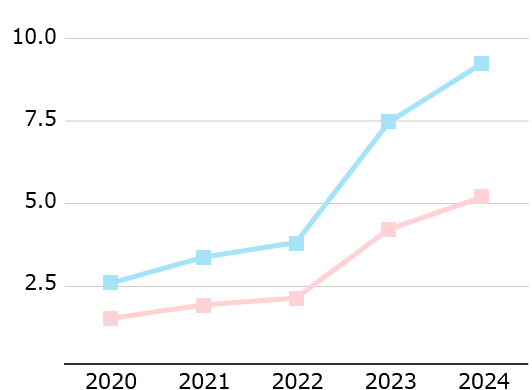
-
■Return on
equity (ROE)
■Return on
assets (ROA)
(%)
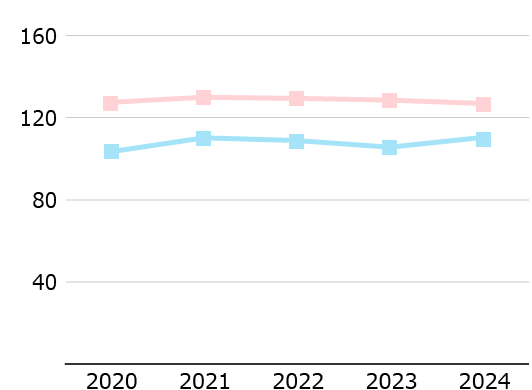
-
■Current
ratio
■Ratio of
total fixed assets to total stockholders' equity
(%)
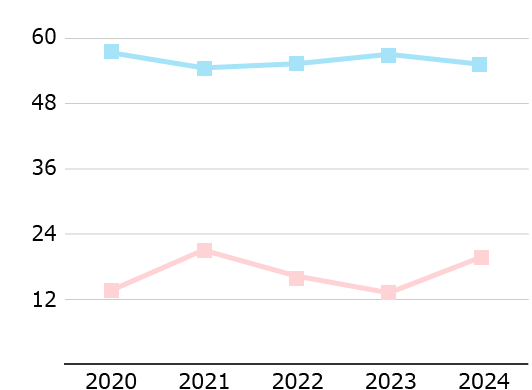
-
■Equity
ratio
■Debt-to-equity
ratio
(%)
| |
2021 |
2022 |
2023 |
2024 |
2025 |
| Gross profit
margin |
32.25% |
31.57% |
32.21% |
32.63% |
32.68% |
| Operating
margin |
1.99 |
1.97 |
3.74 |
4.03 |
4.18 |
| Ordinary
income margin |
2.51 |
2.63 |
4.30 |
4.68 |
4.74 |
| Net income
margin |
1.32 |
1.45 |
2.80 |
3.44 |
3.37 |
| Return on
equity (ROE) (1) |
3.25 |
3.70 |
7.36 |
9.14 |
9.03 |
| Return on
assets (ROA) (2) |
1.80 |
2.01 |
4.10 |
5.08 |
5.07 |
| Current ratio
|
110.12 |
108.79 |
105.56 |
110.31 |
111.02 |
| Ratio of total
fixed assets to total stockholders'
equity |
129.86 |
129.31 |
128.48 |
126.82 |
120.88 |
| Equity ratio
|
54.06 |
54.81 |
56.54 |
54.69 |
57.57 |
| Debt-to-equity
ratio (3) |
20.80 |
16.08 |
13.01 |
19.56 |
15.62 |
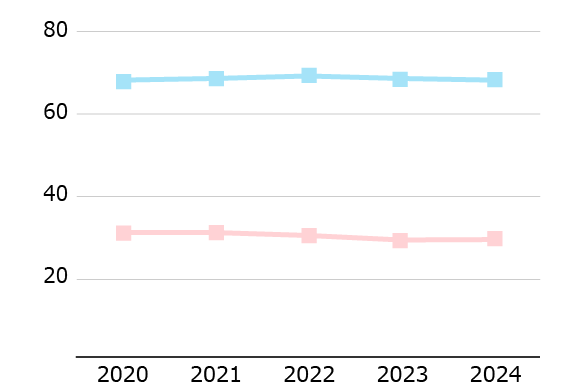
-
■Ratio of
cost of sales to net sales
■Ratio of
selling, general and
administrative
expenses to net sales
(%)
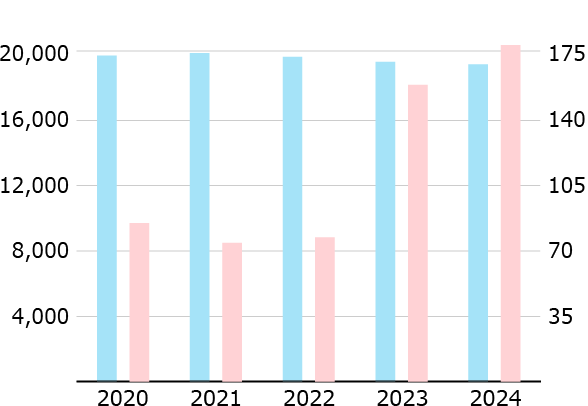
-
■Number of
employees
■Oparating
income per employee
(No.of
employees)
(Ten thouthand
of yen)
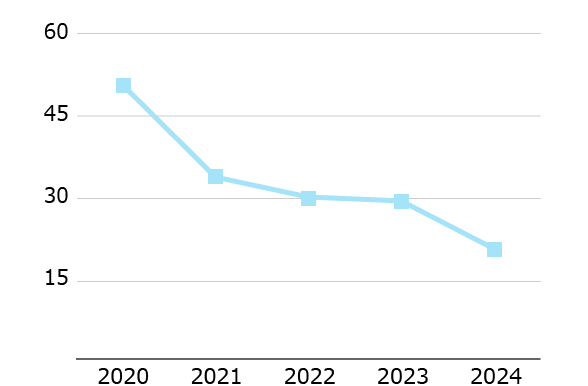
-
■Price-earnings
ratio
(Times)
-
■Price-book
value ratio
(Times)
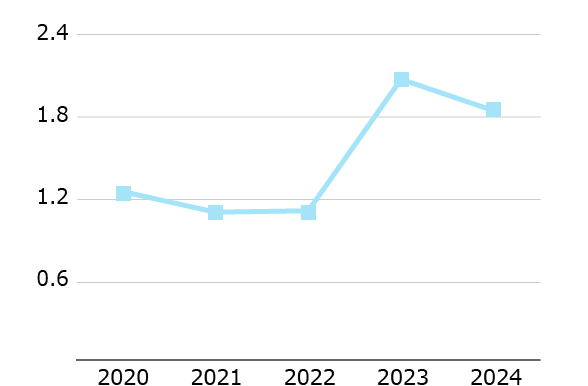
(%, No. of
employees, Yen, Times)
| |
2021 |
2022 |
2023 |
2024 |
2025 |
| Ratio of cost
of sales to net sales(%) |
67.8% |
68.4% |
67.8% |
67.4% |
67.3% |
| Ratio of
selling, general and administrative
expenses to net sales(%) |
30.3 |
29.6 |
28.5 |
28.6 |
28.5 |
| Number of
employees |
19,985 |
19,750 |
19,446 |
19,291 |
19,175 |
| Oparating
income per employee(Yen) |
738,059 |
768,061 |
1,579,278 |
1,791,216 |
1,943,230 |
| Price-earnings
ratio (Times) |
33.22 |
29.58 |
28.87 |
20.15 |
21.67 |
| Price-book
value ratio (Times) |
1.08 |
1.09 |
2.05 |
1.82 |
1.89 |
| |
2021 |
2022 |
2023 |
2024 |
2025 |
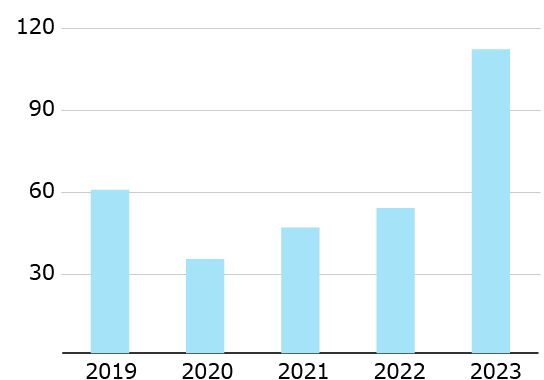
| Net income per
share(Yen) |
46.00 |
53.21 |
111.39 |
146.05 |
151.97 |
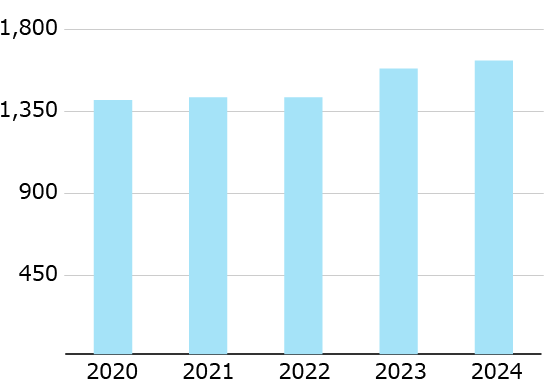
| Net assets per
share(Yen) |
1,413.35 |
1,443.86 |
1,570.53 |
1,614.89 |
1,742.61 |
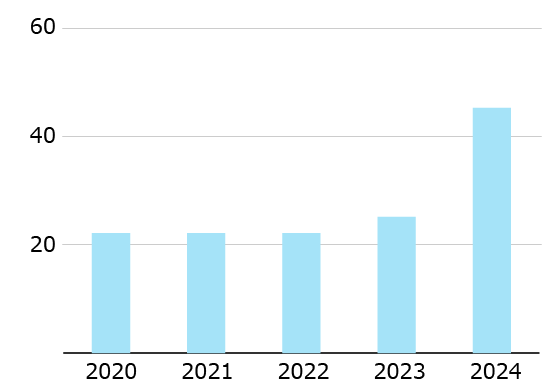
| Cash dividends
per share(Yen) |
22.00 |
22.00 |
25.00 |
45.00 |
60.00 |
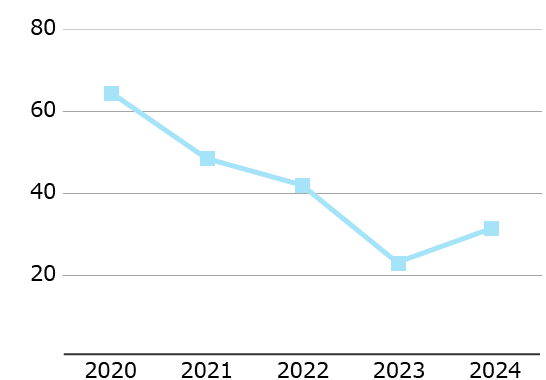
| Dividend
payout ratio(%) |
47.83% |
41.35% |
22.44% |
30.81% |
39.48% |
|
|
|
|