|
|
 |

-
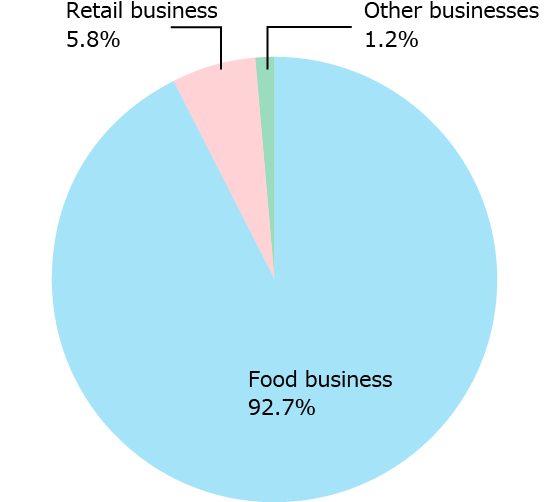
Percentage of Net Sales by
Segment
-
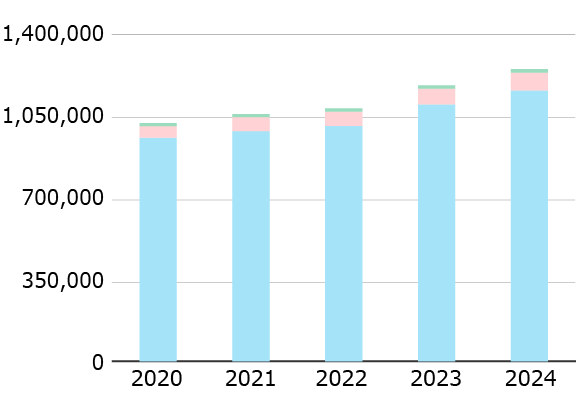
Net Sales by Segment
■Food
business
■Retail
business
■Other
businesses
(Millions of yen)
-
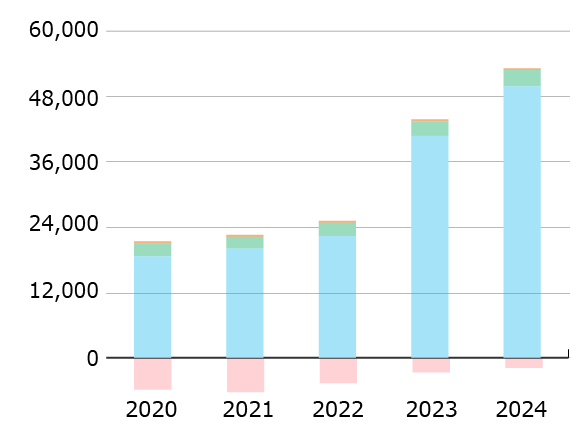
Operating Income by Segment
■Food
business
■Retail
business
■Other
businesses
■Adjustment
(Millions of yen)
-
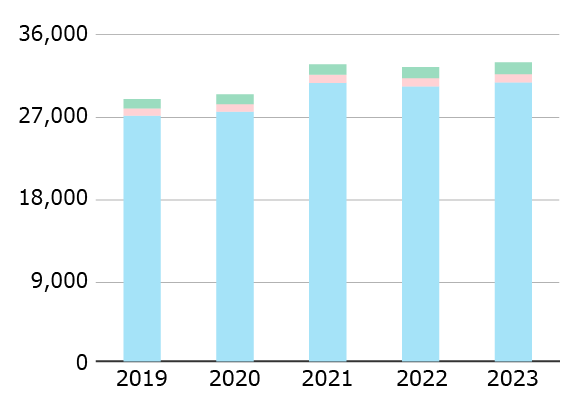
Number of Employees by
Segment
■Food
business
■Retail
business
■Other
businesses
(No. of employees)
Net Sales by Segment
(Millions of yen)
| Years Ended
December 31 |
2021 |
2022 |
2023 |
2024 |
2025 |
| Food business
|
¥980,599 |
¥1,002,148 |
¥1,093,762 |
¥1,153,504 |
¥1,215,940 |
| Retail
business |
59,494 |
61,657 |
67,952 |
76,200 |
79,790 |
| Other
businesses |
12,878 |
13,203 |
13,847 |
14,783 |
15,699 |
| Net sales
|
¥1,052,972 |
¥1,077,009 |
¥1,175,562 |
¥1,244,488 |
¥1,311,430 |
Operating Income by Segment
(Millions of yen)
| Years Ended
December 31 |
2021 |
2022 |
2023 |
2024 |
2025 |
| Food business
|
¥20,027 |
¥22,326 |
¥40,704 |
¥49,796 |
¥58,448 |
| Retail
business |
△4,193 |
△3,101 |
△1789 |
△1,235 |
△884 |
| Other
businesses |
2,154 |
2,427 |
2,682 |
3,017 |
3,351 |
| Adjustment
|
371 |
380 |
364 |
294 |
225 |
| Operating
income |
¥18,359 |
¥22,032 |
¥41,962 |
¥51,873 |
¥61,141 |
Number of Employees by
Segment
(No. of employees)
| Years Ended
December 31 |
2021 |
2022 |
2023 |
2024 |
2025 |
| Food business
|
30,490 |
30,107 |
30,554 |
31,008 |
31,154 |
| Retail
business |
907 |
891 |
899 |
907 |
906 |
| Other
businesses |
1,130 |
1,212 |
1,272 |
1,478 |
1,485 |
| Total number
of employees |
32,527 |
32,210 |
32,725 |
33,393 |
33,545 |
|
|
|
|